After you collect NGINX access logs to Simple Log Service, you can specify a query statement to query all request methods and visualize the request methods on a table of a dashboard. If you want to highlight failed requests on the table, you can configure color settings for the table.
Prerequisites
NGINX access logs are collected. For more information, see Collect text logs from servers.
Indexes are created. For more information, see Create indexes.
Overview

Query and analyze data: You can query and analyze the collected logs in the Simple Log Service console. For example, you can retrieve logs, aggregate logs, and collect statistics on logs.
Add a chart: Each dashboard consists of multiple charts. Each chart displays the results of one or more query statements.
Configure color settings for a table: Specify colors for table text, table cells, or table rows.
Step 1: Query and analyze data
Log on to the Simple Log Service console. In the Projects section, click the project you want.
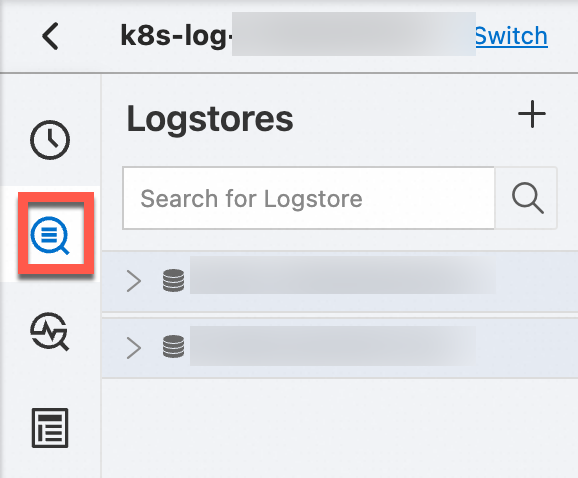
In the left-side navigation pane, click Log Storage. In the Logstores list, click the logstore you want.
Enter a query statement in the search box and click Last 15 Minutes to specify a query time range.
For example, you can specify the following statement to query the request methods and request status of all requests:
* | SELECT request_method,status
Step 2: Add a table
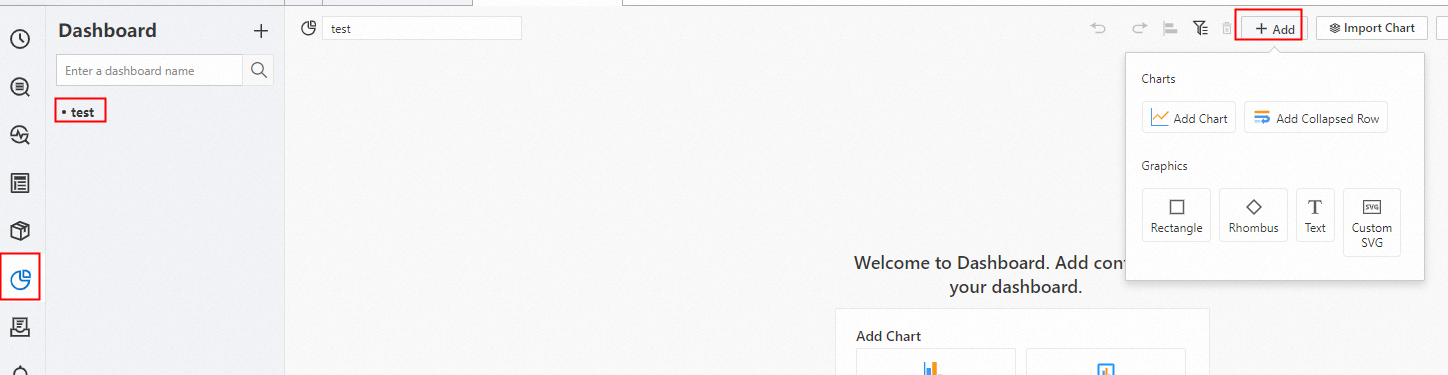
In the left-side navigation pane, choose Dashboard > Dashboards. In the dashboard list, click the dashboard you want. In the upper-right corner of the dashboard page, click Edit. In edit mode, click Add > Add Chart.
On the General Configurations tab, click the Table Pro icon in the Chart Types section. On the Search & Analysis tab, select Logstore (SQL) and choose the logstore you want, and enter the query statement. Select a time range, such as Last 15 Minutes, and click OK.

Step 3: Configure color settings for a table
Specify colors for table text
: Select Threshold as the color scheme for the table. The color of the table is displayed based on the threshold that you specify.
: Select Text Highlight to highlight the values of the
statusfield in the results of Query Statement A.: Set the threshold to 400 for the
statusfield in the results of Query Statement A. Ifa value of the status field is greater than or equal to 400, the color of the value is red. Ifa value of the status field is less than 400, the color of the value is green.

Specify colors for table cells
: Select Threshold as the color scheme for the table. The color of the table is displayed based on the threshold that you specify.
: Select Background Highlight to highlight the cells that accommodate specific values of the
statusfield in the results of Query Statement A.: Set the threshold to 400 for the
statusfield in the results of Query Statement A. Ifa value of the status field is greater than or equal to 400, the color of the cell that accommodates the value is red. Ifthe value of the status field is less than 400, the color of the cell that accommodates the value is green.
Specify colors for table rows
: Select Threshold as the color scheme for the table. The color of the table is displayed based on the threshold that you specify.
: Select Full Line Background Highlight to highlight the rows that accommodate specific values of the
statusfield in the results of Query Statement A.: Set the threshold to 400 for the
statusfield in the results of Query Statement A. Ifa value of the status field is greater than or equal to 400, the color of the row that accommodates the value is red. Ifthe value of the status field is less than 400, the color of the row that accommodates the value is green.
